
Although English is far and away the dominant language spoken in the US, the number of people in the United States who spoke a language other than English at home nearly tripled from 23.1 million (about 1 in 10) in 1980 to 67.8 million (almost 1 in 5) in 2019, according to a recently released US Census Bureau report.
The Hispanic (Latino) population is the largest minority group in the United States. So it is not surprising Spanish was the most common non-English language spoken in U.S. homes (62%) in 2019.
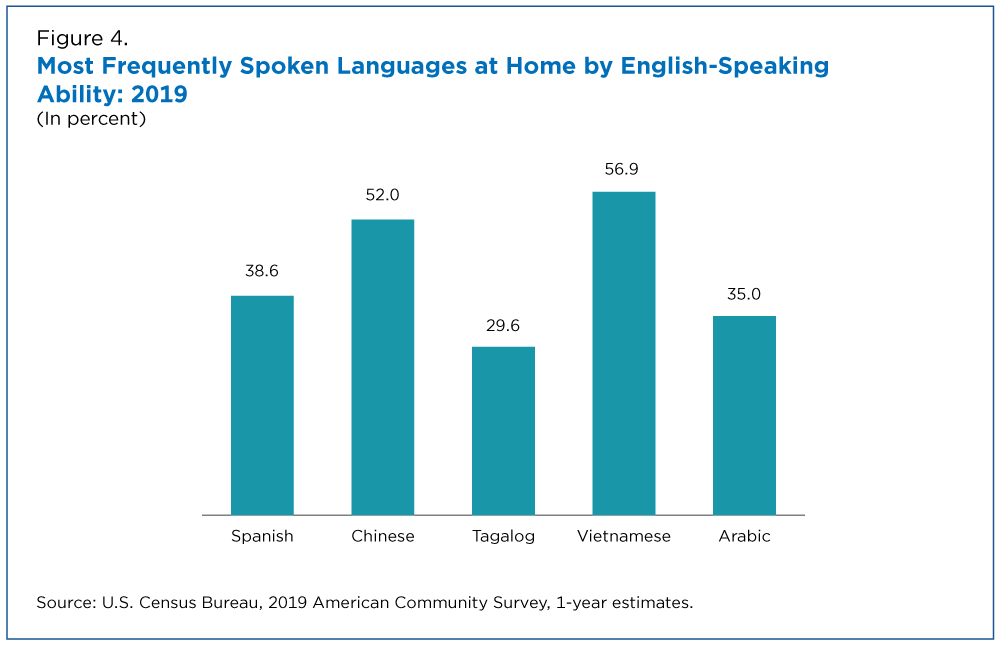
What is surprising are the next four frequently languages spoken at home are, in descending order, are Chinese, Tagalog, Vietnamese and Arabic, a reflection of the fastest growing demographic and immigration rate in the US.
The Census report, Language Use in the United States: 2019, uses American Community Survey (ACS) data to highlight trends and characteristics of the different languages spoken in the United States over the past four decades.

In 2019, 51% of Tagalog and 54% of Chinese speakers had a bachelor’s degree or higher (these two groups were not statistically different from each other) compared to only 17% of Spanish speakers. Figure 3 shows educational attainment for the U.S. population ages 25 years and older by language spoken at home.
About a third (33%) of Spanish speakers did not graduate from high school, the largest share of speakers of the five most common languages other than English.
Employment status of speakers ages 16 and over did not vary much across the five languages (Figure 3). Less than 4% were unemployed in 2019 – not significantly different than the national average.

The federal government relies on data on language use and English proficiency to provide language services under the Voting Rights Act, as well as to allocate educational funds to state English as a Second Language (ESL) programs.
Based on the 2019 data, 52% of people who spoke Chinese and 57% of those who spoke Vietnamese at home in the United States spoke English “less than very well,” compared to the other three common languages: Spanish 39%, Tagalog 30%, and Arabic 35%. This may have resulted from a recent increase in immigration from Asia and newcomers who have not had enough time to assimilate and master
Household Characteristics by Language
In addition to individual differences, there were also differences in the US households that spoke the five most frequently spoken non-English languages.
A limited English-speaking household is one in which no members ages14 and over speak only English or speak English “very well.” About a third of Chinese (33%) and Vietnamese (31%) households were limited English-speaking households – four times greater than Tagalog households.
In contrast, Tagalog-speaking households were more likely to be “non-limited” English speaking. About 92% of Tagalog-speaking households were non-limited English speaking and only 8% were limited English speaking.
The majority of households across all five languages were family households, defined as having at least two members (including the householder) related by birth, marriage or adoption. On average, these households each had zero to one child under age 18 and three to four persons in the family.
Among nonfamily households, defined either as a person living alone or one who shares the housing unit with nonrelatives such as boarders or roommates, a greater proportion (30%) of Chinese-speaking households were nonfamily compared to households speaking the other four languages. Half as many Tagalog-speaking households (17%) were nonfamily households.

FYI: For a comprehensive review at the individual languages and languages groups spoken in the United States by statisticians Sandy Dietrich Erik Hernandez, refer to the Language Use in the United States: 2019 report.Stop Asian Hate, a community group tracking the recent surge of attacks against AANHPI in the US and Canada, lists several incidents reported where Asian Americans were attacked for speaking an Asian language.
Some of the ifirst-generation immigrants learned English, but preferred to speak their native languages, especially at home. Their children largely grew up bilingual, but many chose to speak English, even to their immigrant parents. When this bilingual generation established their own homes, they usually spoke English at home. “Consequently, by the third generation, the prevalent pattern is English monolingualism, and knowledge of the mother tongue for most ethnics is fragmentary at best,” according to a Pew report.
No comments:
Post a Comment