
ANALYSIS
Asian American voters remain solidly with the Democratic Party despite recent stories making it appear that Asian American voters are moving to the right.
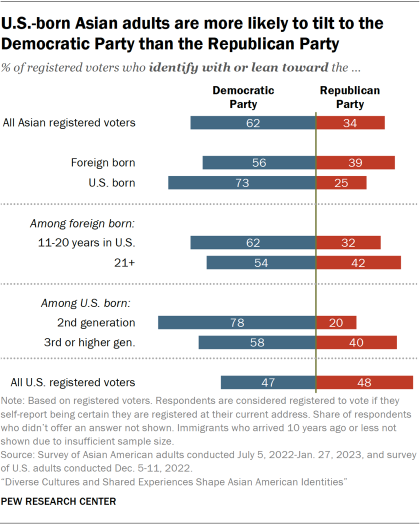
About six-in-ten Asian American registered voters (62%) identify as Democrats or lean to the Democratic Party, and 34% are Republicans or GOP leaners, according to a Pew Research Center survey of Asian adults conducted from July 2022 to January 2023.Admittedly, the Pew survey found that Vietnamese Americans broke from the left-leaning trend. It found that about half of Vietnamese American registered voters are Republicans or lean to the GOP – the highest share across the five largest Asian origin groups in the United States.

However, Democrats should guard against taking the AANHPI vote for granted. The Democrats should be concerned that Republicans have been able to take advantage of some dissatisfaction among Asian American voters at the local level where the electorate felt they were being ignored resulting in progressives were ousted in San Francisco and New York.
There also has been a noticeable movement towards supporting a stronger police presence and a questioning of educational equity at the local level that gives the appearance of a move towards conservative values.
Races in which Asian American voters voted for Republicans are still the exceptions and doesn't indicate a trend. That was the case in California's Orange County where Vietnamese voters, the most conservative of Asian Americans, were apparently swayed by the anti-communist rhetoric of Rep. Michelle Steel, a Korean American, in the 2022 midterms.
However, that doesn't necessarily mean a rightward shift on local concerns translates to the national level where the majority of AANHPI voters, especially Indian Americans and FIlipino Americans, align with Democrats on issues such as affirmative action, healthcare, the economy, reproductive rights, immigration, voting rights, gun control and civil rights.
The diversity under the Asian American umbrella shows a wide spectrum of political views but there is still a strong lean towards the Democrats.
Around two-thirds of US registered voters who are Filipino (68%), Indian (68%) or Korean (67%) identify as Democrats or lean Democratic. Chinese American voters are also majority Democratic (56%), while Vietnamese American voters tilt to the GOP (51% Republican, 42% Democratic), reports the Pew study.
Asian voters are more likely than voters overall to affiliate with the Democratic Party: US registered voters are about evenly split between the Democratic Party (47%) and the Republican Party (48%).
Overall, 80% of Asian Americans who are US citizens ages 18 and older (and therefore eligible to vote) report being “absolutely certain” that they are registered to vote at their current address. This includes about three-quarters or more in each of the five origin groups in the Pew analysis.
Differences in Asian voter identification by age, gender, education and immigrant status
Among Asian registered voters, majorities across most demographic groups favor the Democratic Party, but there are some differences by age, gender and other factors:
- Younger Asian registered voters are far more likely than older ones to tilt Democratic. Among all Asian Americans who are registered to vote, 88% of those under 30 identify with or lean to the Democratic Party, compared with 67% of those ages 30 to 49, 51% of those 50 to 64 and 48% of those 65 and older.
- Just 11% of Asian registered voters under 30 are Republicans or lean to the GOP, compared with larger shares in older age groups. Among Asians 65 and older, for instance, 43% are Republicans or Republican leaning.
- Among Asian registered voters, women are more Democratic than men. About two-thirds of Asian women who are registered voters are Democrats or lean to the Democratic Party (67%), compared with 56% of Asian men.
- Asian registered voters with a lower level of education are somewhat more likely to support the GOP. For instance, 45% of those with a high school diploma or less education are Republicans or lean Republican, compared with 30% of Asian voters with a bachelor’s degree and 27% of those with a postgraduate degree.
- Asian registered voters born in the U.S. are more likely than those who immigrated to the country to affiliate with the Democratic Party. About three-quarters of those born in the U.S. are Democrats or lean Democratic (73%), compared with 56% of foreign-born Asian registered voters.
- A quarter of US-born Asians are Republicans or lean to the GOP, as are 39% of those who are foreign born.
- About four-in-ten foreign-born Asian registered voters who have lived in the country for more than 20 years identify as Republican or lean to the GOP (42%). This compares with about a third (32%) of those who have spent 11 to 20 years in the US.
Asian Americans represent a relatively small but fast-growing segment of the US electorate. In 2021, 13.4 million Asian Americans were eligible to vote, making up 5.6% of all eligible voters, according to a Pew Research Center analysis of the 2021 American Community Survey.
Eligible voters in this analysis are defined as US citizens ages 18 and older who live in the 50 states and the District of Columbia. Not all eligible voters are registered to vote.
In 2021, the 2.8 million Chinese American eligible voters in the U.S. accounted for the largest population of any Asian origin group, followed by Filipino (2.6 million), Indian (2.1 million), Vietnamese (1.3 million) and Korean American (1.1 million) eligible voters.

Where the voters live
As of 2021, the majority of Asian American eligible voters (56%) live in just five states.
The state with the highest share is California, which is home to 4.3 million Asian eligible voters – accounting for about a third (32%) of the total Asian eligible voter population.
The state with the second-largest share of Asian American eligible voters is New York (1.1 million), followed by Texas (960,000), Hawaii (575,000) and New Jersey (545,000).
Among each of the country’s five most populous Asian origin groups, California also has the highest share of eligible voters of each group.
This includes about four-in-ten eligible voters who are Filipino (41%), Chinese (38%) or Vietnamese (37%). Three-in-ten Korean eligible voters (29%) and one-fifth of Indian eligible voters (20%) live in California as well.
The second-largest share of eligible voters among each origin group varies among the ethnic subgroups from state to state.
Some 14% of Vietnamese eligible voters live in Texas, and 7% of Filipino eligible voters live in Hawaii. New York is home to 15% of Chinese, 11% of Indian and 7% of Korean eligible voters.
EDITOR'S NOTE: For additional commentary, news and views from an AANHPI perspective, follow @DioknoEd on Twitter or at his blog Views From the Edge.
No comments:
Post a Comment