Showing posts with label Census. Show all posts

Tuesday, April 9, 2024

Federal agencies will do a better job surveying Asian Americans, Native Hawaiians and Pacific Islanders


While it might be politically convenient to be seen as a collective group under the umbrella of "Asian American, Native Hawaiian and Pacific Islander, (AANHPI)," in almost all other cases, the differences between the 70-or-so subgroups of people from Asia and the Pacific region are great enough to require separating those communities from each other.

Last week, tthe US Office of Management and Budget (OMB) published a set of revisions, the first since 1997, to Statistical Policy Directive No. 15: Standards for Maintaining, Collecting, and Presenting Federal Data on Race and Ethnicity (SPD 15)— aiming to ensure that federal data on race and ethnicity is more detailed, accurate, and useful, and that the information collected is standardized across federal agencies.

“Today’s OMB announcement is no minor bureaucratic change or maneuver; it’s a once-in-a-generation breakthrough," said Rep. Judy Chu, chair of the Congressional Asian Pacific American Caucus. "This update to federal race and ethnicity data standards—earned after years of campaigning by advocates and CAPAC—marks a historic milestone for AANHPI communities."

"Asian American" which was born out of political empowerment of the 1960s, is not helpful when collecting data for the wide-ranging health, economic status, educational needs of the more than70 ethnicities and national origens that make up the so-called AANHPI community.

The disaggregation of the race,  and ethnicity category options across federal agencies ensures that the federal government can more effectively tailor programs and policies to reach underserved populations and serve all of our communities.

The US Census Bureau stated that it will study the OMB directive as it will affect the way the bureau conducts the next Census in 2030 that will include the additional racial and ethnic categories.

Grouping AANHPI communities into a single category often masks the disparities that certain racial or ethnic groups face, including on economic prosperity, health outcomes, home ownership, or educational attainment, and make government programs and services less responsive and effective.


For example, the household wealth gap is greatest within the AANHPI communities. Among Asian American subgroups, Indian Americans have the highest median income ($119,000), followed by Filipino Americans ($90,000), Japanese Americans ($83,000) and Chinese Americans ($82,000). Asian Americans are experiencing faster income inequality growth than other demographic groups, according to the Pew Research Center, as Burmese Americans make a median income of $44,000.

It is safe to assume that the needs and concerns of the upper-income Indian Americans are different from Burmese Americans.

“Race and ethnicity are important factors to understanding patients’ risk factors for disease, their patient experience in the complex health care system, and how providers can provide compassionate and effective care.," said Thu Quach, PhD, AAPCHO board president and president of Asian Health Services, a federally qualified health center in Alameda County, California.

The "issuance of the revisions is merely the first step in the long-awaited modernization of our nation’s race and ethnicity standards. Together with OMB, other agencies, and our partners, we look forward to beginning the substantive work of implementing these revisions,” said Terry Ao Minnis, Vice President of Census and Voting Programs.

“Additionally, further research is needed to better inform the standards, including ensuring the detailed groups used will in fact elicit the best responses across all racial and ethnic groups, such as through proper signaling to the diverse set of detailed subgroups in each category," said John C. Yang, President and Executive Director of Advancing Justice – AAJC.  

"OMB and other agencies must continue meaningful engagement with community groups as they begin to implement these revised standards; continued coordination with advocacy groups will ensure that data are accessible and usable for the broader public—not just federal agencies and experts.”

Community advocates, including Advancing Justice – AAJC, considers data collection and reporting to be the backbone of its mission. The revised standards will help better document the diversity of the Asian American community, who are among our nation’s fastest growing and most diverse racial groups. Often viewed as homogenous, these communities include more than 30 detailed subgroups that can differ dramatically across key social and economic indicators.

Data collected by the federal agencies will caategorized under more racial and ethnic categories, including: Chinese, Asian Indian, Filipino, Vietnamese, Korean, Japanese or another group (for example, Pakistani, Hmong, Afghan). The Native Hawaiian and Pacific Islander category will broken down as well: Native Hawaiian, Samoan, Chamorro, Tongan, Fijian, Marshallese or another group (for example, Chuukese, Palauan, Tahitian).

"Requiring the collection of data on Asian American subgroups will contribute to a fuller understanding of our communities, including how to best serve the most marginalized subgroups," saidYang. "This is something we have been advocating for extensively for more than a decade.”

EDITOR'S NOTE: For additional commentary, news and views from an AANHPI perspective, follow me at Threads.net/eduardodiok@DioknoEd on Twitter or at the  blog Views From the Edge.


Friday, December 22, 2023

Immigrants driving growth in the US


Immigrants from Asia and other countries are keeping the United States population from stagnation. If not for immigration, the US population would have declined this year.

The US gained more than 1.6 million people in the past year, an increase driven by immigrants and a lower death rate, according to data released this week by the US Census Bureau. The total immigrant population grew by almost 30% between 2005 and 2022, climbing to just over 46 million people. Foreign-born Americans made up 13.9% of the US population in 2022, up 1.5 percentage points from 2005.

Immigration from Asia drove growth in Asian American communities last year, accounting for two-thirds of the 577,000-person increase in people who identify as Asian, including those who identify with more than one race. The 2.4% increase was the largest of any race or ethnic group, boosting Asian American population to 24.6 million

The county with the showing the most increase in the US is King County, Washington — home to Seattle — which added almost 21,500 Asian residents last year. 

There were more than 1.7 million Native Hawaiians and other Pacific Islanders in the U.S. last year, an increase of 1.2% over the previous year. Clark County, Nevada, home to Las Vegas, had the biggest increase, with almost 1,500 new residents. So many Native Hawaiians, seeking the high cost of living in their island state, were responsible for that growth.

With it's proximity to the US, Mexico provides the most immigrants, but the next three countries are India, China and the Philippines. In fact, five of the top ten countries are Asian countries.

Immigrants' top ten countries of origin


“Immigrant and refugee communities bring talent, culture and a set of skills that are needed in our community,” said Arrey Obenson, president and CEO of the International Institute of St. Louis, which helps newcomers adapt to life in the US.

In the 2000 U.S. Census, the Federal Government defines “Asian American” to include persons having origins in any of the original peoples of the Far East, Southeast Asia, or the Indian subcontinent. “Native Hawaiian and Other Pacific Islander” includes Native Hawaiian, Samoan, Guamanian or Chamorro, Fijian, Tongan, or Marshallese peoples and encompasses the people within the United States jurisdictions of Melanesia, Micronesia and Polynesia. The previous “Asian and Pacific Islander” (API) category was separated into “Asian Americans” and “Native Hawaiians and Other Pacific Islanders” (NHOPI).

The rise marked a bump of 0.5% as more states saw population gains than in any year since the start of the pandemic, bringing the US population to 334,914,895. While the increase is historically low, it’s higher than those seen in 2022 (0.4%) and 2021 (0.2%) when immigration slowed because of COVID-19.

The states that saw the largest growth in foreign-born residents over the five years were Texas, Florida, California and New Jersey.

The small growth in the white population was driven by Latinos, or Hispanics, who identified themselves as being white. Without the Hispanic Whites, the White population in the US would have shown a decrease.

Other highlights of the Census report:

  • During the 2018-2022 period, there were an estimated 45.3 million foreign-born people in the United States; 13.7% of the nation’s total population.
  • The foreign-born population rose by more than 5 million between the 2008-2012 (39.8 million) and 2018-2022 periods.
  • The Foreign-born made up over a fifth of the state population in California (26.5%), New Jersey (23.2%), New York (22.6%) and Florida (21.1%) in 2018-2022.
  • Florida, Texas, California and New Jersey had the largest numeric increases in the foreign-born population between 2008-2012 and 2018-2022.
  • Almost half (49.1%) of all foreign-born people entered the United States before 2000, and more than half of all foreign-born people (52.3%) were naturalized U.S. citizens in 2018-2022.
  • During the 2018-2022 period, an 18.7% share of the foreign-born population 25 years and older had a bachelor’s degree as their highest degree and 14.9% had a graduate or professional degree, compared to 21.4% and 13.1% of the native-born population 25 years and older.
  • Nearly two-thirds (63.5%) of the foreign-born population 16 years and older were employed in the civilian labor force, and more than a third of the foreign-born U.S. civilian employed population (16 years and older) worked in management, business, science and arts occupations in 2018-2022.
EDITOR'S NOTE: For additional commentary, news and views from an AANHPI perspective, follow me at Threads.net/eduardodiok, @DioknoEd on Twitter or at the blog Views From the Edge.

Monday, June 12, 2023

Loving Day 2023: Multiracial people the fastest growing population in the US

Richard and Mildred Loving defied the status quo.


Love conquers all! The movement towards a more multiracial population in the United States might scare the holy bejeebus out of white supremacists, but the good news is that the trend is unmistakable, according to data released by the US Census.


Count among the growing number of multiracial Asian American celebrities singer H.E.R, actor Darren Criss, US Senator Tammy Duckworth, tennis player Naomi Osaka and, of course, Vice President Kamala Harris.

Some have even coined the word "hapa" that originally meant a person of Hawaiian and White heritage but in recent usage, has grown to refer to those individuals who are Asian mixed with some other race. It is no wonder that Hawaii has the largest percentage of blended individuals -- 40% of the island state's population.

As we mark Loving Day, June 12, the day the US Supreme Court ruled that a white man and black woman, Richard and Mildred Loving, can legally marry, repealing the anti-miscegenation laws that dominated most of the nation for centuries. Since then, the mixing of the races has taken a natural path as people of different races, increase interaction with each other at work, play, school and in their communities.
RELATED: 

After getting arrested in Virginia in 1958 for having an interracial marriage, nine years later the Lovings won their case on June 12th, 1967. It was more than a victory for their family. It struck down all state laws against interracial marriage in the US. However, it wasn't until 2000 when Alabama complied.

For those Asian American immigrants who came to the US after that date, it might seem inconceivable that such laws existed as recent as 23 years ago. It goes to show how far the US has come as a country that today, interracial relationships are much more commonplace.

It is no coincidence that Loving Day takes place as we celebrate Multiracial Heritage Week, June 7-14.


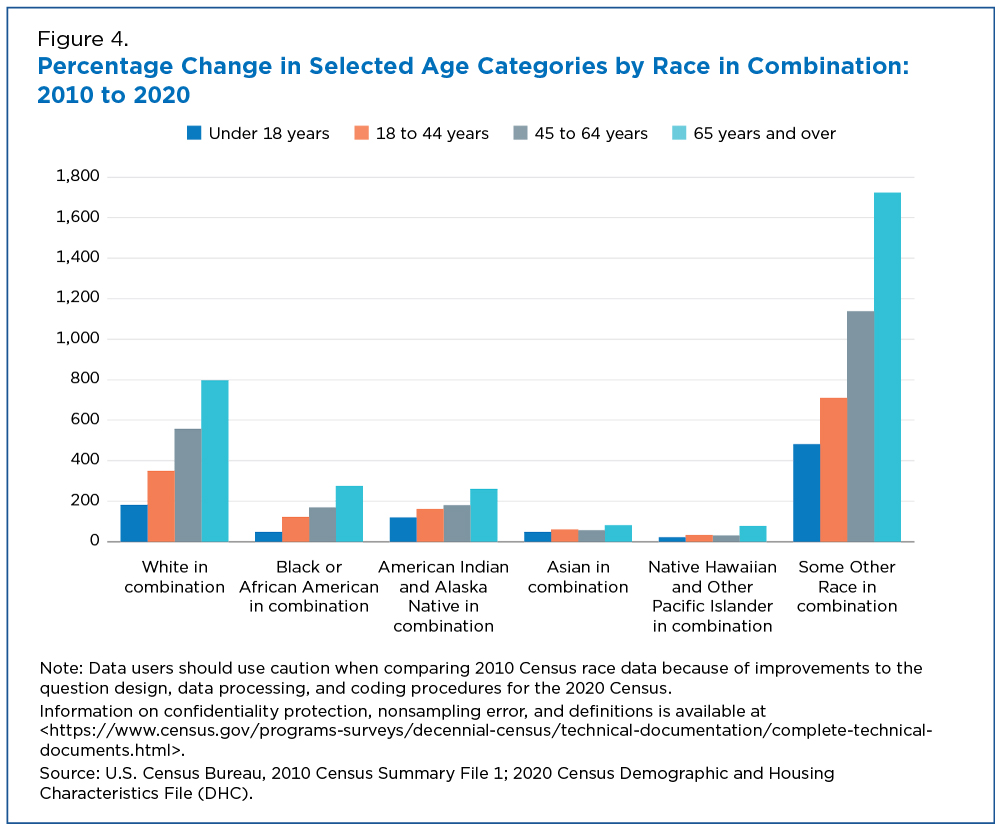
Census figures show that the population that reported multiple races grew faster than all race alone groups in 2020. Figure 4 shows age-specific changes for each race in combination population between the 2010 and 2020 censuses.

All race in combination groups saw growth across each age category over the decade. The Some Other Race in combination population grew the fastest – by over 482% for every age category.

Figure 4. Percentage Change in Selected Age Categories by Race in Combination: 2010 to 2020


Nearly all groups saw population gains this decade and the increase in the Two or More Races population (referred to throughout this story as the Multiracial population) was especially large (up 276%). The White alone population declined by 8.6% since 2010.

The 2020 Census shows:
  • The White population remained the largest race or ethnicity group in the United States, with 204.3 million people identifying as White alone. Overall, 235.4 million people reported White alone or in combination with another group. However, the White alone population decreased by 8.6% since 2010.
  • The Multiracial population has changed considerably since 2010. It was measured at 9 million people in 2010 and is now 33.8 million people in 2020, a 276% increase.
  • The “in combination” multiracial populations for all race groups accounted for most of the overall changes in each racial category.
  • All of the race alone or in combination groups experienced increases. The Some Other Race alone or in combination group (49.9 million) increased 129% surpassing the Black or African American population (46.9 million) as the second-largest race alone or in combination group.
  • The next largest racial populations were the Asian alone or in combination group (24 million), the American Indian and Alaska Native alone or in combination group (9.7 million), and the Native Hawaiian and Other Pacific Islander alone or in combination group (1.6 million).
  • The Hispanic or Latino population, which includes people of any race, was 62.1 million in 2020. The Hispanic or Latino population grew 23%, while the population that was not of Hispanic or Latino origin grew 4.3% since 2010.
Have a lovely Loving Day, folks!

EDITOR'S NOTE: For additional commentary, news and views from an AANHPI perspective, follow @DioknoEd on Twitter or at his blog Views From the Edge.

Tuesday, January 4, 2022

Census lists communities where Asian bilingual ballots will be required


One of the reasons that recent elections saw an increase in AAPI voters was  because of the availability of bilingual ballots and voting material.

The Census Bureau released its updated list of jurisdictions that are required by the federal Voting Rights Act to provide translated ballots, voting materials, and bilingual poll workers for specific language minority groups.

"This list of cities and counties is just a snapshot of the great diversity Asian Americans bring to America, and a reflection of the needs of the fastest growing population of any racial or ethnic group in the country," said Susana Lorenzo-Giguere, Senior Staff Attorney of the Democracy Program at Asian American Legal Defense and Education Fund.


“Voting is a sacred part of our democracy as Americans. For many Asian Americans who speak limited English, the lack of language assistance and bilingual ballots is an unfair barrier to participating in the electoral process," she continued. "The Voting Rights Act promises language access to Americans who cannot speak English well, and speak specific languages, including several Asian languages.

The Language Minority Provisions was included in the 1965 Voting Rights Act because Congress found that:

[T]hrough the use of various practices and procedures, citizens of language minorities have been effectively excluded from participation in the electoral process. Among other factors, the denial of the right to vote of such minority group citizens is ordinarily directly related to the unequal educational opportunities afforded them resulting in high illiteracy and low voting participation. 


The requirements of the law are straightforward: all election information that is available in English must also be available in the minority language so that all citizens will have an effective opportunity to register, learn the details of the elections, and cast a free and effective ballot.

As required by Section 203 of the Voting Rights Act of 1965 (Act), as amended, this notice publishes the U.S. Census Bureau's Director's determinations as to which jurisdictions are subject to the minority language assistance provisions of the Act. As of this date, those jurisdictions that are listed in this Notice as covered by Section 203 have a legal obligation to provide the minority language assistance prescribed by the Act.

Earlier this year, AALDEF filed a Section 203 complaint against Hamtramck, Michigan over its failure to provide election materials and assistance in Bengali. As a result, the court entered a consent decree ordering Hamtramck’s Bengali language election program for four years. And in 2014, AALDEF filed a complaint against Philadelphia City Commissioners over denial of language access to voters under a municipal ordinance.

The bilingual information may be one of the reasons top officials of Hamtramck are Muslim including the five City Council members and the mayor.

The following jurisdictions are mandated to provide information and assistance in the specific Asian languages (with newly covered jurisdictions/languages in bold italics):

ALASKA
Aleutians West Census Area: Filipino
Kodiak Island Borough: Filipino

CALIFORNIA
Alameda County: Chinese (including Taiwanese), Filipino, Vietnamese
Contra Costa County: Chinese (including Taiwanese)
Los Angeles County: Cambodian, Chinese (including Taiwanese), Filipino, Korean, Vietnamese
Orange County: Chinese (including Taiwanese), Korean, Vietnamese
Sacramento County: Chinese (including Taiwanese), Vietnamese
San Diego County: Chinese (including Taiwanese), Filipino Vietnamese
San Francisco County: Chinese (including Taiwanese)
San Mateo County: Chinese (including Taiwanese), Filipino
Santa Clara County: Chinese (including Taiwanese), Filipino, Vietnamese

HAWAII
Honolulu County: Chinese (including Taiwanese), Filipino
Maui County: Filipino

ILLINOIS
Cook County: Chinese (including Taiwanese), Asian Indian (including Sikh)

MASSACHUSETTS
Lowell city: Cambodian
Malden city: Chinese (including Taiwanese)
Quincy city: Chinese (including Taiwanese)
Randolph Town city: Vietnamese

MICHIGAN
Hamtramck city: Bangladeshi

MINNESOTA
Ramsey County: Hmong

NEVADA
Clark County: Filipino

NEW JERSEY
Bergen County: Korean
Middlesex County: Asian Indian (including Sikh)

NEW YORK
Kings County (Brooklyn): Chinese (including Taiwanese)
New York County (Manhattan): Chinese (including Taiwanese)
Queens County (Queens): Bangladeshi, Chinese (including Taiwanese), Korean, Asian Indian (including Sikh)

PENNSYLVANIA
Philadelphia County: Chinese (including Taiwanese)

TEXAS
Dallas County: Vietnamese
Harris County: Chinese (including Taiwanese), Vietnamese
Tarrant County: Vietnamese

VIRGINIA
Fairfax County: Vietnamese

WASHINGTON
King County: Chinese (including Taiwanese), Vietnamese


AALDEF conducts surveys in various Asian languages.


There are now 32 jurisdictions in 14 states mandated by Section 203 to provide voters with Asian language election information assistance, an increase of five jurisdictions from the Census Bureau’s determinations in 2016, consistent with the census reports showing that Asian Americans are the fastest growing population among all racial and ethnic groups in the United States in the last decade.

For the first time in the United States, the Hmong language is covered under the Voting Rights Act. Minnesota has the largest population of Hmong Americans, and newly covered Ramsey County, Minnesota, is the hometown and birthplace of U.S. Olympic gold medalist Suni Lee.

When the Census certifies that 5% or more than 10,000 voting-age citizens in a town or county speak another language, are limited English speaking, and have a higher illiteracy rate than the national illiteracy rate, the jurisdictions must translate ballots, voter registration forms, voting instructions, and all other voting materials they provide in English. They must also provide translated oral assistance on election matters at polling places. The list of covered jurisdictions and the languages for translated voting materials is now updated every five years, as a result of the 2006 amendments to the Voting Rights Act.

Sunday, December 13, 2020

US Census: Asian American household incomes rises


Asian Americans, the fastest growing segment of the U.S. society, on average, have higher household incomes and highest education attainment of any population group, according to a U.S. Census analysis.

The U.S. Census Bureau released new 5-year statistics in its American Community Survey Dec. 10 that gives a glance at America's people giving number crunchers, investment planners and service providers an idea of social and economic trends in various communities. 

Deeper dives into the mountain of data are sure to follow to explain the how's and why's of the findings. The Census Bureau will also issue yearly surveys to keep trends current. Also, the survey doesn't include 2020 and the impact of the coronavirus pandemic during which Asian Americans suffered high job losses and business closures.

The survey's data shows that Asian households had the highest increase among ethnic group with a rise of 7.9% in median income when comparing the five-year survey of 2005–2009 and 2015– 2019, from $81,772 to $88,204, almost an 8% increase.

The increase of the nationwide median household income was only 2.3% in comparing the same periods, according to the survey. Non-Hispanic White householders experienced an increase of 3% in median household income between 2005-2009 and 2015-2019, from $66,767 to $68,785; Black householders increased 1.9% and Hispanic or Latino householders increased 5.9%

There are many factors for the increase household income among Asian Americans, but one of them is likely to be educational attainment.

The Census survey showed that the same time period from 2005-2019 to 2015-2019, the Asian Americans had the highest rate of bachelor's degree attainment; 54.3% of Asian Americans held at least bachelor's degrees, followed by non-Hispanic Whites.

The household income increase varied from state to state. There were increases in 27 states and the District of Columbia. Puerto Rico and 20 states had changes that were not statistically significant. Median household income for 2015–2019 was the highest in New Jersey ($121,111) and was among the lowest in South Dakota ($52,786).9 Puerto Rico ($22,390) had the lowest 2015–2019 median income for Asian householders.

Nine states and the District of Columbia had median incomes for Asian households that were higher than the U.S. median for Asian households. Puerto Rico and 38 states had median incomes for 9 The median income for Asian households in South Dakota was not significantly different from the median income for Asian households in Idaho, Mississippi, Montana, Nebraska, Vermont, West Virginia, and Wyoming. Asian households that were lower than the U.S. median. 

The medians for Asian households in Michigan, New Hampshire, and Texas were not statistically different from the U.S. median.

The American Community Survey also gave a picture of Americans' home ownership, poverty rate and education. 

Sunday, May 10, 2020

Sunday Read: Asian American electorate doubles its number and increases its influence


US politicians, Democrats and Republicans, can no longer afford to ignore the Asian American voter. From 2000 to 2020, the number of Asian American eligible voters more than doubled, growing by 139%, according a Pew Research Center analysis of Census Bureau data.
In the same two decades Hispanic voters grew at a similar rate (121%), but the black and white electorates grew far more slowly (33% and 7%).


"If candidates work to reach out to our communities — many of which have low English proficiency — and work to push issues they care about, we could definitely see an impact in November," AAPI Vote executive director Christine Chen told NBC Asian America.

More than 11 million Asian American voters will be able to cast their ballots this year, making up nearly 5% of the nation’s eligible voters. They are also the only major racial or ethnic group in which naturalized citizens – rather than the US born – make up a majority of eligible voters,


Because most Asian Americans are first-generation immigrants, there are about 4.5 million future voters waiting to become full-fledged US citizens and voters. Between 2000 and 2018 – the most recent year available – the number of Asian immigrant eligible voters doubled from 3.3 million to 6.9 million. As of 2018, naturalized citizens accounted for about two-thirds of all U.S. Asian eligible voters.

Since 2000, newcomers from Asia have made up the greatest number of immigrants to the US, surpassing immigrants coming from Mexico.

The Asian American electorate reflect the composition of entire Asian American communities with 85% coming from China, the Philippines, India, Vietnam, South Korea and Japan, according to the Pew analysis. 

More than half of the Asian Americans live in only three states. California is home for 3.6 million Asian American voters or 35% of the U.S. Asian electorate, followed by New York with 920,000 voters and Texas, 698,000. 

In the swing state of Texas, the growing Asian American electorate could turn the red state to blue for the Demcratic presidential candidate and possibly elect its first Asian American congressmembers -- Sri Preston Kulkarni and Gina Ortiz Jones.

Hawaii is the only state where Asian American voters make up the largest share, 38%, of the electorate. California Asian American voters with 14% of the electorate is an increasingly politically influential group.

Both Democrats and Republicans have increased outreach to the Asian American communities but according to AAPI Data, the majority of the Asian American electorate leans towards the Democratic Party. Vietnamese American voters tend to trend towards the GOP.

In the 2018 election, 77 percent of AAPI voters supported a Democratic House candidate. Support of Asian American voters was critical in the 2018 midterm elections delivering traditional Republican districts to the Democrats.

Meanwhile, only in Hawaii do Asian Americans account for a larger share of eligible voters than any racial or ethnic group. They make up 38% of the state’s eligible voters, by far the highest share in the country. California has the next highest share with 14%.

Immigrants from the Philippines has the highest rate of naturalization of all contributing countries with 82% of the permanent residents from the Philippines eligible for citizenship swore their allegiance to the US, according to an earlier Pew study.

As more of the newly arrived become US citizens, the influence and power of Asian American voters is expected to grow even more.

Monday, July 8, 2019

Asian languages spoken widely in 18 states


Graphic: Business Insider

I love walking the streets of New York City and San Francisco. I could sit in one spot and the world would pass by -- tourists and residents speaking a cacophony of foreign languages.

Nothing emphasizes the US's immigrant heritage than the ton of languages people speak at home. English and Spanish, of course, are the two main languages spoken across the country. But the third most spoken language in each state, may be surprising to you.

Waiting at a crosswalk in San Francisco, one can imagine being in Manila with all the Tagalog being spoken. In California, where I'm based, the Filipino dialect Tagalog is the most frequently spoken language after English and Spanish. 

The US Census Bureau's American Community Survey annually asks more than 1 million Americans questions about their lives, families, and backgrounds. One question asks respondents what language they mainly speak in their homes.

Using individual-level responses from the 2017 American Community Survey assembled and published by the Minnesota Population Center's Integrated Public Use Microdata Series program, Business Insider found the most common language spoken at home in each state, excluding English and Spanish.
In neighboring Nevada, Tagalog is also the most spoken language at home. That wouldn't be a surprise if you've wandered through the tourist attractions and The Strip and you saw the number of Filipino employees employed by the casinos. Filipinos are the largest Asian American ethnic group in Las Vegas.

Nationally, the estimated number of Tagalog speakers is 1,753,712, according to the Census Bureau.

Another Filipino dialect, Ilocano, is the major language in Hawaii. During the heyday of sugarcane and pineapples, huge number of Filipinos from the Ilocos region, north of Manila were brought in by the plantation owners to join the Japanese and Chinese workers who were already in the fields. Today, 85% of the Filipino population in Hawaii is Ilocano and with the Tagalog speakers, Filipino Americans make up the largest Asian ethnic group in the state.

Other Asian languages that are spoken widely are:
  • Not surprisingly, Chinese is the language from Asia that has the most speakers. The largest Asian ethnic group, which includes Taiwanese, number over 5 million, of which 2,155,939, speak one of the Chinese languages. The states where they are the most commonly spoken language at home other than English and Spanish are New York, Washington, Arkansas, Missouri, Utah.

  • Korean-Americans are the fifth-largest Asian immigrant group in the US and have 1,104,145 Americans speak Korean at home. They are almost entirely from South Korea, The states where Korean is the most commonly spoken language at home other than English and Spanish are Virginia, Alabama and Georgia.


  • Gujarati is the most common Indian language in New Jersey. Its speakers originally came from the western Indian state of Gujarat. In the US, there are 419,964 Gujarati speakers.

  • Vietnamese is the most commonly spoken language at home other than English and Spanish in Texas, Oklahoma, Oregon, Kansas, Iowa and Mississippi thanks to over 1.5 million Vietnamese speakers. Over half of all Vietnamese-Americans live in either California or Texas.
  • Although many Nepalese people have settled in Nebraska, where Nepalese is the language spoken at home for relative to other immigrant communities, the actual number is unclear. The biggest single Nepalese group is in New York City, with 9,000 people. Nationwide, there are 202,218 Nepalese speakers.

German is the most commonly spoken non-English, non-Spanish language in nine states, with French most common in six states and D.C.

Sunday, June 23, 2019

Sunday Read: US is getting older and more diverse


America is starting to look like the people in this photo.


I'm still not used to it when the Filipina American grocery clerk addresses me with "po," an honorific term added on to show respect for an elder, as in "Salalmat, po!" (Thank you, sir.)

I was taken aback when a Filipino American I worked alongside with called me, "manong," another sign of respect for an "older brother."

My presence and position in this country points out two things -- America is getting older and more racially diverse. So the question is: Will wisdom come with aging?

It took me awhile but like many of the baby boomer generation, I finally conceded that I have gotten older. I was not alone.

The US as a whole continues to grow older with the median age increasing to 38.2 years in 2018, up from 37.2 years in 2010. The pace of this aging is different across race and ethnicity groups, according to new 2018 Population Estimates by demographic characteristics for the nation, states and counties, released today by the U.S. Census Bureau.

“The nation is aging — more than 4 out of every 5 counties were older in 2018 than in 2010. This aging is driven in large part by baby boomers crossing over the 65-year-old mark. Now, half of the U.S. population is over the age of 38.2,” said Luke Rogers, the Chief of the Population Estimates Branch at the Census Bureau. “Along with this general aging trend, we also see variation among race and ethnicity groups both in growth patterns and aging.”

As the nation continues to grow older, it is also changing by race and ethnicity. View the Census Bureau's graphic on the age and race distribution from 2010 to 2018 to see how the nation has grown more diverse. With the Fourth of July just weeks away, here's a snapshot of what the nation looks like based on the Census findings:

  • California was the only state to have an Asian population larger than 5 million, at 6,890,703 in 2018. New York (1,922,974) and Texas (1,688,966) were the only two states that had a population between 1.0 million and 4.9 million.
  • The American Indian and Alaska Native population was over 1.0 million in only one state, California, at 1,089,694 in 2018.
  • In 2018, 36 states and the District of Columbia had a Native Hawaiian and Other Pacific Islander population that was less than 20,000. The two states with the largest Native Hawaiian and Other Pacific Islander populations in 2018 were Hawaii (382,261) and California (363,437).
  • Of the 50 states and the District of Columbia, 20 had a white population of 5.0 million or more, 21 were between 1.0 million and 4.9 million, nine were between 500,000 and 999,999, and one, the District of Columbia, had a population between 100,000 and 499,999.
The Asian Population
  • In 2018, 2.7 percent (86) of counties had an Asian population of 50,000 people or more. The Asian population was less than 1,000 people in 73.1 percent (2,297) of counties.
  • Los Angeles County, California, had the largest Asian population in 2018 (1,720,889). King County, Washington, had the largest numeric increase in the Asian population, increasing by 23,932 (5.1 percent) between 2017 and 2018.
  • Among counties with a total population of 20,000 or more in 2017 and 2018, the Asian population grew the fastest in Forsyth County, Georgia, increasing by 11.5 percent (3,734) between 2017 and 2018.
The American Indian and Alaska Native Population
  • In 2018, 20 counties (0.6 percent) had an American Indian and Alaska Native population of 50,000 or more. Also in 2018, 635 counties (20.2 percent) had an American Indian and Alaska Native population between 1,000 and 4,999 and 1,272 (40.5 percent) counties had an American Indian and Alaska Native population that was between 100 and 499. The American Indian and Alaska Native population was less than 1,000 people in 2,219 (70.6 percent) counties.
  • Los Angeles County, California had the largest American Indian and Alaska Native population in 2018 (231,340). Maricopa County, Arizona, had the largest numeric increase, growing by 3,745 (2.4 percent).
  • Among counties with a total population of 20,000 or more in 2017 and 2018, the American Indian and Alaska Native population had the fastest growth in Clark County, Nevada, increasing by 3.5 percent (1,690) between 2017 and 2018.
The Native Hawaiian and Other Pacific Islander Population
  • In 2018, only three (0.1 percent) counties had a Native Hawaiian and Other Pacific Islander population of 50,000 or more — these were Honolulu County (245,043) and Hawaii County (70,910) in Hawaii, and Los Angeles County, California (67,730). In 2018, 578 (18.4 percent) counties had a population between 100 and 499 people and 2,217 (70.6 percent) counties had a Native Hawaiian and Other Pacific Islander population that was less than 100 people.
  • Honolulu County, Hawaii, had the largest Native Hawaiian and Other Pacific Islander population at 245,043 people in 2018. Clark County, Nevada, had the largest numeric growth, increasing by 1,458 between 2017 and 2018.
  • Among counties with a population of 20,000 or more in 2017 and 2018, Pierce County, Washington, had the fastest Native Hawaiian and Other Pacific Islander population increase, growing by 4.9 percent (1,085) between 2017 and 2018.
The White Population
  • The white population remained the largest group in the nation at 78.9 percent (258,080,572), and had the largest numeric increase from 2017 to 2018 (1,055,588).
  • In 2018, the white population was greater than or equal to 50,000 in 906 (28.8 percent) counties and between 10,000 and 49,999 people in 1,390 (44.2 percent) of counties. In 2018, 48 (1.5 percent) counties had a white population that was less than 1,000 people.
  • Los Angeles County, California, had the largest white population, at 7.4 million in 2018. Maricopa County, Arizona had the largest increase in the white population between 2017 and 2018, growing by 60,749 (1.6 percent).
  • Among counties with a population of 20,000 or more in 2017 and 2018, Williams County, North Dakota, had the fastest growth in the white population at 5.3 percent (1,596) between 2017 and 2018.
So, despite the fears of white supremacists, egged on by racists like Donald Trump, Steven Miller and other conservative TV and radio personalities, Whites are nowhere close to disappearing. They are still in the majority in most of the country ... for now.

But what the Census figures do show is that the US is changing and barring something disastrous like the construction of a 30-foot wall along our coastlines and borders -- demographic shifting is inevitable. Sometime in the mid-century, whites will make up less than 50% of the country according to population trends. 

How the different races and ethnic groups choose to share the economic and political power and learn to accommodate each other -- not only as neighbors but in the board rooms and halls of our capitols -- will determine the future of our country.


Saturday, June 15, 2019

Citizenship question: Emails reveal possible ties between the Census Bureau and GOP strategists


Newly discovered evidence contradicts the Trump administration’s claims that it added a citizenship question to the 2020 Census simply to enforce the federal Voting Rights Act, and confirms that the purpose was to deprive Asian and Latino Americans of constitutionally protected political representation.

The revelations from the email communications prompted two civil rights agencies to attempt to submit the new evidence to the courts, hoping to affect a Supreme Court decision that will be handed down later this month, perhaps as early as next week.

Court documents filed Friday (June 14) show that the current Chief of Staff to the Director of the U.S. Census Bureau was in direct contact with a Republican redistricting strategist in 2015, concerning issues related to the citizenship question.

The documents submitted to U.S. District Court Judge George J. Hazel on Friday reveal the first evidence of direct contact between Thomas B. Hofeller, a GOP strategist, and Christa Jones, a Census Bureau official, who was the main intermediary between the Census Bureau and Secretary Ross when the decision was issued in March of 2018.

"They eliminate any colorable doubt about the link between Hofeller and government employees involved in the citizenship question approval process," write plaintiffs' attorneys with the law firm Covington & Burling, the Mexican American Legal Defense and Educational Fund and Asian Americans Advancing Justice — AAJC.

Asian Americans Advancing Justice | AAJC (Advancing Justice | AAJC) and MALDEF (Mexican American Legal Defense and Educational Fund) submitted the new evidence and on Tuesday, June 18, will ask Hazel to reconsider whether the administration conspired with others to intentionally discriminate against Latinos and non-citizens.

“While the Supreme Court has taken up legal claims to remove the Census citizenship question based on violation of the Administrative Procedures Act and the Enumeration clause of the Constitution, there remain very serious questions around the increasingly strong evidence of unconstitutional racial discrimination behind the citizenship question,” said Thomas A. Saenz, MALDEF president and general counsel. 

“These questions must be authoritatively resolved before the Census moves forward; our Census must be free of the horrible taint of unconstitutional discrimination.”

Late last month The New York Times revealed that Hofeller, now deceased, worked with the administration to include a citizenship question as a way to unlawfully advantage “Republicans and Non-Hispanic Whites.”

The two civil rights advocates sued the Trump administration in May 2018 on behalf Latino and Asian American individuals, Native Americans, social service non-profits, state legislative associations, civil rights groups, voting rights organizations, and community partnerships that would be forced to divert resources to combat a potential severe undercount in their respective communities.

On April 5, 2019, Hazel ruled that the addition of the citizenship question violates the Administrative Procedure Act and the Enumeration Clause of the U.S. Constitution. The court, however, fell short of granting MALDEF’s and Advancing Justice | AAJC’s claim that the administration’s intention in adding the question was to discriminate against non-citizens and communities of color in the decennial Census, in violation of the Equal Protection Clause of the Fifth Amendment, and that members of the administration conspired to deprive racial minorities of their constitutional right to equal representation.

Census data are crucial to allocating seats in Congress, drawing accurate election districts and ensuring equitable distribution of federal funds for a wide range of vital programs.

MALDEF and Advancing Justice | AAJC filed an appeal on April 14th in the U.S. Court of Appeals 4th Circuit challenging Judge Hazel’s ruling on the question of whether the motive for adding the citizenship question was unconstitutionally discriminatory. That appeal is moving forward.

Read the brief HERE
_______________________________________________________________

Tuesday, May 14, 2019

Census says there are 22.2 million Asian Americans and rising


The Asian American population in the United States is now 22.2 million, according to the U.S. Census Bureau based on their estimates as for the year 2017.
That is an 18% increase, or 4 million more than the 2010 census. Because the community's high immigration rate, Asian America is the fastest growing ethnic community in the U.S.

The Census also said there are 1.6 million Native Hawaiians and other Pacific Islanders

For Asian Pacific American Heritage Month, the Census released a batch of new numbers pertaining to Asian and Paciiic Americans.

The following facts are made possible by the invaluable responses to the U.S. Census Bureau’s surveys. We appreciate the public’s cooperation as we continuously measure America’s people, places and economy.

Asian Americans

22.2 million

The estimated number of Asians, alone or in combination, residents in the U.S. in 2017.
Source: 2017 Population Estimates

5.0 million
The estimated number of the Asian population of Chinese, except Taiwanese, descent in the United States in 2017. The Chinese (except Taiwanese) population was the largest Asian group, followed by Asian Indian (4.4 million), Filipino (4.0 million), Vietnamese (2.1 million), Korean (1.9 million) and Japanese (1.5 million). These estimates represent the number of people who reported a specific detailed Asian group alone, as well as people who reported that detailed Asian group in combination with one or more other detailed Asian groups or another race(s).
Source: 2017 American Community Survey


2.4%

The percentage of Asian alone or in combination military veterans in 2017.
Source: 2017 American Community Survey 

The percentage of the Asian alone or in combination population age 25 and older who had at least a high school diploma or equivalency in 2017.
Source: 2017 American Community Survey

555,262

The estimated number of Asian-owned employer firms in the United States in 2016.

Source: 2016 Annual Survey of Entrepreneurs


For more Stats about Asian Americans, click here.


Native Hawaiian and Other Pacific Islander Population

1.6 million

The estimated number of Native Hawaiian and Other Pacific Islander alone or in combination residents of the United States in 2017.
Source: 2017 Population Estimates

614,572

The number of Native Hawaiian residents of the United States in 2017. The Native Hawaiian population was the largest detailed Native Hawaiian and Other Pacific Islander (NHPI) group, followed by Samoan (202,268) and Guamanian or Chamorro (156,482). These estimates represent the number of people who reported a specific detailed NHPI group alone, as well as people who reported that detailed NHPI group in combination with one or more other detailed NHPI groups or another race(s).
Source:2017 American Community Survey

7.1%

The percentage of Native Hawaiian and Other Pacific Islander alone or in combination military veterans in 2017.
Source:2017 American Community Survey

23.3%

The percentage of the Native Hawaiian and Other Pacific Islander alone or in combination population age 25 and older who had a bachelor’s degree or higher in 2017.
Source:2017 American Community Survey

89.4%

The percentage of the Native Hawaiian and Other Pacific Islander alone or in combination population age 25 and older with at least a high school diploma or equivalency in 2017.
Source:2017 American Community Survey

5,157

The estimated number of Native Hawaiian and Other Pacific Islander-owned employer firms in the United States in 2016.
 

For more stats on this demographic group, click here.