 |
| Richard and Mildred Loving defied the status quo. |
Love conquers all! The movement towards a more multiracial population in the United States might scare the holy bejeebus out of white supremacists, but the good news is that the trend is unmistakable, according to data released by the US Census.
You can thank Richard and Mildred Loving.
Count among the growing number of multiracial Asian American celebrities singer H.E.R, actor Darren Criss, US Senator Tammy Duckworth, tennis player Naomi Osaka and, of course, Vice President Kamala Harris.
Some have even coined the word "hapa" that originally meant a person of Hawaiian and White heritage but in recent usage, has grown to refer to those individuals who are Asian mixed with some other race. It is no wonder that Hawaii has the largest percentage of blended individuals -- 40% of the island state's population.
As we mark Loving Day, June 12, the day the US Supreme Court ruled that a white man and black woman, Richard and Mildred Loving, can legally marry, repealing the anti-miscegenation laws that dominated most of the nation for centuries. Since then, the mixing of the races has taken a natural path as people of different races, increase interaction with each other at work, play, school and in their communities.
As we mark Loving Day, June 12, the day the US Supreme Court ruled that a white man and black woman, Richard and Mildred Loving, can legally marry, repealing the anti-miscegenation laws that dominated most of the nation for centuries. Since then, the mixing of the races has taken a natural path as people of different races, increase interaction with each other at work, play, school and in their communities.
RELATED:After getting arrested in Virginia in 1958 for having an interracial marriage, nine years later the Lovings won their case on June 12th, 1967. It was more than a victory for their family. It struck down all state laws against interracial marriage in the US. However, it wasn't until 2000 when Alabama complied.
For those Asian American immigrants who came to the US after that date, it might seem inconceivable that such laws existed as recent as 23 years ago. It goes to show how far the US has come as a country that today, interracial relationships are much more commonplace.
It is no coincidence that Loving Day takes place as we celebrate Multiracial Heritage Week, June 7-14.
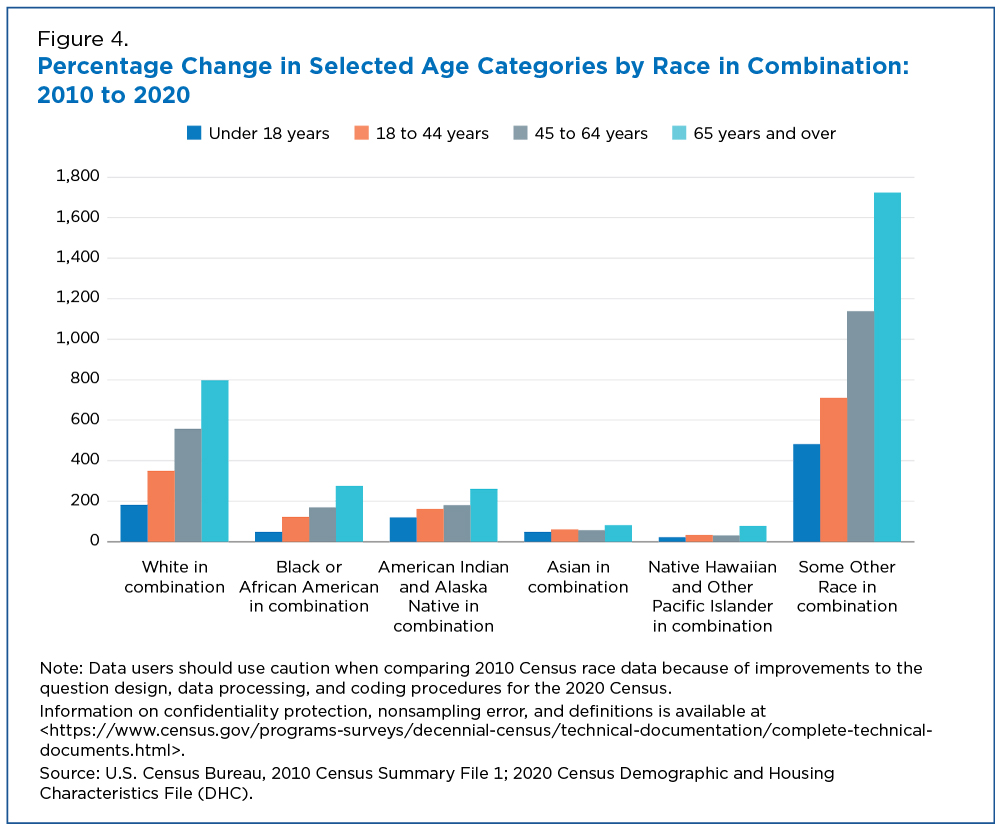
Census figures show that the population that reported multiple races grew faster than all race alone groups in 2020. Figure 4 shows age-specific changes for each race in combination population between the 2010 and 2020 censuses.
All race in combination groups saw growth across each age category over the decade. The Some Other Race in combination population grew the fastest – by over 482% for every age category.

Nearly all groups saw population gains this decade and the increase in the Two or More Races population (referred to throughout this story as the Multiracial population) was especially large (up 276%). The White alone population declined by 8.6% since 2010.
EDITOR'S NOTE: For additional commentary, news and views from an AANHPI perspective, follow @DioknoEd on Twitter or at his blog Views From the Edge.
All race in combination groups saw growth across each age category over the decade. The Some Other Race in combination population grew the fastest – by over 482% for every age category.

Nearly all groups saw population gains this decade and the increase in the Two or More Races population (referred to throughout this story as the Multiracial population) was especially large (up 276%). The White alone population declined by 8.6% since 2010.
The 2020 Census shows:
- The White population remained the largest race or ethnicity group in the United States, with 204.3 million people identifying as White alone. Overall, 235.4 million people reported White alone or in combination with another group. However, the White alone population decreased by 8.6% since 2010.
- The Multiracial population has changed considerably since 2010. It was measured at 9 million people in 2010 and is now 33.8 million people in 2020, a 276% increase.
- The “in combination” multiracial populations for all race groups accounted for most of the overall changes in each racial category.
- All of the race alone or in combination groups experienced increases. The Some Other Race alone or in combination group (49.9 million) increased 129% surpassing the Black or African American population (46.9 million) as the second-largest race alone or in combination group.
- The next largest racial populations were the Asian alone or in combination group (24 million), the American Indian and Alaska Native alone or in combination group (9.7 million), and the Native Hawaiian and Other Pacific Islander alone or in combination group (1.6 million).
- The Hispanic or Latino population, which includes people of any race, was 62.1 million in 2020. The Hispanic or Latino population grew 23%, while the population that was not of Hispanic or Latino origin grew 4.3% since 2010.
Have a lovely Loving Day, folks!

No comments:
Post a Comment