Showing posts with label Pew Researcch Center. Show all posts

Friday, December 29, 2023

Pew Research Center: TheAsian American population grew in every state


California is far and away the favorite destination of Asian Americans but as their population continues to grow, Asian Americans are finding homes and creating communities in  the other 49 states, too.

The Asian American population has increased in every state and the District of Columbia over the past two decades, according to an analysis by the Pew Research Center. California had an Asian population of roughly 5.9 million in 2019, by far the nation’s largest. It was followed by New York (1.7 million), Texas (1.5 million), New Jersey (870,000) and Illinois (732,000). A majority of U.S. Asians (56%) live in these five states.

In terms of growth rates, North Dakota and South Dakota saw the fastest increases in their Asian American populations between 2000 and 2019. The Asian populations in both states more than tripled during that time. Indiana, Nevada and North Carolina also saw significant growth as their Asian populations increased by 183%, 176% and 175%, respectively.


California, Texas and New York saw the most robust numerical growth in their Asian American populations between 2000 and 2019. Together, these three states accounted for 43% of overall Asian population growth in the U.S. during that period. 

The number of Asian Americans grew by over 2 million in California, by 883,000 in Texas and by 617,000 in New York. Notably, the Asian population grew more in Texas than in New York during this span, even though more Asians still reside in New York.
Asian American population growth in some states surpassed the state’s overall population growth

In West Virginia, the Asian population increased between 2000 and 2019 even though the state’s overall population declined. The decrease in West Virginia’s overall population can be largely attributed to a decline in the state’s White population, which makes up a majority of the state’s populace.

In four other states, increases in the number of Asian Americans between 2000 and 2019 exceeded the state’s overall population growth. That was especially apparent in Michigan, where the Asian population grew by more than four times as much as the state’s overall population (151,000 vs. 34,000). New York, Illinois and Rhode Island had similar patterns, though to a lesser degree.

In two other states, Asian Americans accounted for more than half of statewide population growth from 2000 to 2019. Asians accounted for 83% of total population growth in New Jersey and 57% in Connecticut during this span.

Asian Americans recorded the fastest population growth rate among all racial and ethnic groups in the United States between 2000 and 2019. 

The Asian population in the US grew 81% during that span, from roughly 10.5 million to a record 18.9 million, according to a Pew Research Center analysis of US Census Bureau population estimates.

The  census show that Asian American population has continued to rise to over 24 million by 2023. 

Ancestral diversity among Asians in the US is quite noteworthy to political and economic interests. The three largest ancestry groups among Asian Americans are Chinese (including Taiwanese) at 23.6%, Asian Indian at 23% and Filipino representing 15.7% of the US Asian population.

Furthermore, by 2060, the number of US Asians is projected to rise to 35.8 million, more than triple their 2000 population.

Hispanics saw the second-fastest population growth between 2000 and 2019, followed by Native Hawaiians and Pacific Islanders (NHPI) at 70% and 61%, respectively. The nation’s Black population also grew during this period, albeit at a slower rate of 20%. There was virtually no change in the White population.

EDITOR'S NOTE: For additional commentary, news and views from an AANHPI perspective, follow me at Threads.net/eduardodiok@DioknoEd on Twitter or at the blog Views From the Edge.

Thursday, November 30, 2023

Pew Report: Discrimination experiences shape most Asian Americans’ lives


Most people of color have experienced discrimination in the United States. Sad, but it's a hard fact of life for Asian Americans and other POC.

And no matter how forgiving one is, experiencing bias is bound toshape a person's outlook and how one lives life day-to-day. 

Today, 57% of Asian adults living in the US see discrimination against  Asian Amricans as a major problem, according to a new Pew Research Center analysis.  A majority of those surveyed (63%) report that too little attention is paid to the racial issues concerning Asian Americans.

“I feel like Asians are kind of known as the model minority," said a Chinese American who took part in the study. "That kind of puts us in an interesting position where I feel like we’re supposed to excel and succeed in the media, or we’re seen in the media as exceeding in all these things as smart. All of us are not by any means. Yeah, I feel like we’re in this weird middle ground.”

Overall, 58% of Asian adults say they have ever experienced racial discrimination or been treated unfairly because of their race or ethnicity. This includes 53% who say they experience racial discrimination from time to time and 5% who say they experience it regularly.

        FYI: Read the entire report here.

In addition to this general question, the survey also asked about specific discrimination incidents:

• 78% of Asians living in the US have been treated as a foreigner in some way, even if they were born in the United States. This includes Asian adults who say that in day-to- day encounters, strangers in the US have told them to go back to their “home country”; assumed they can’t speak English; criticized them for speaking a language other than English; or mispronounced their name.

• 63% of Asian Americans have experienced incidents where people assume they are a “model minority,” which includes those who say strangers have assumed that they are good at math and science or not a creative thinker. The model minority stereotype generalizes Asians in the US as intelligent, well-off and only able to excel in technical fields. At the same time, more than half of Asian adults (55%) say they have not heard of the term “model minority.”

• 37% of Asian adults say strangers have called them offensive names in day-to-day encounters. US born-Asian adults are nearly twice as likely as Asian immigrants to say this has happened to them (57% vs. 30%).

• 20% of Asian adults say they have been held back at a security checkpoint for a secondary screening because of their race or ethnicity. Across regional origin groups. One respondent said: 

"After 9/11, things changed a lot. I feel like things changed for a lot of us and I remember my parents putting out American flags everywhere – outside the house, on the mailbox, like wherever they could stick them. And even now, I do get … constantly pulled over when you’re in line at the airport, by TSA and at this point I just know I’m going to get pulled over. … I make my way leisurely to that section because I know that they’re going to profile me.”

South Asian adults are the most likely to have this experience, with 35% saying so. This is about twice the share reported by Southeast (15%) and East (14%) Asian adults.

Notably, the survey found that 38% of Asian adults who were born in the U.S. or immigrate here before they were 18 years old say that when they were growing up, their family never talked about the challenges they might face because of their race or ethnicity.

The multilingual, nationally representative survey conducted from July 5, 2022, to Jan. 27, 2023, among 7,006 Asian adults, asked about personal experiences with 17 different discrimination incidents. Asian Americans’ day-to-day encounters with discrimination were not just single events, but often came in several overlapping forms.

EDITOR'S NOTE: For additional commentary, news and views from an AANHPI perspective, follow me at Threads.net/eduardodiok@DioknoEd on Twitter or at the  blog Views From the Edge.

Tuesday, September 12, 2023

Pew Study: 1 in 5 Asian Americans hide their ethnic identity

YOUTUBE

ANALYSIS

One of my pet peeves about some AANHPI of mixed race heritage, especially Filipino Americans: When asked the inevitable question, "What are you ... really?" The response I decry lists part this, part that, this and that, and then at the very end, as an afterthought, they'd add, "... and Filipino," even though one of their parents is full-blooded Filipino.

It is as if they were ashamed to admit that part of their racial make-up. Apparently, this desire to fit in is common beyond Filipino Americans and afflicts many in the AANHPI communities, according to a new survey by the Pew Research Center.

“[It] was kind of that stigma when you were little, a teen, or you were younger that [you] don’t want to speak Chinese … because people would think that you’re a FOB [fresh off the boat] or an immigrant,” said one respondent, a 2nd generation Chinese American in his early 30s.

RELATED: How Asian Americans identify themselves
Many recent Asian immigrants said they have tried to fit into the US and fear that others may judge them negatively for sharing their heritage. US-born Asian Americans with immigrant parents often said they hid their heritage when they were growing up to fit into a predominantly White society.

FYI: For the complete Pew survey

In it's wide-ranging survey, which Pew teleased earlier this year, the research center learned that 1 in 5 Asian American adults say they have hidden a part of their heritage – cultural customs, food, clothing or religious practices – from non-Asians at some point in their lives. 

Fear of ridicule and a desire to fit in are common reasons they give for doing this, according to a Pew Research Center survey of Asian adults in the United States conducted from July 2022 to January 2023.

Why some Asian Americans hide their heritage

Pew analysts found tht Korean Americans are more likely than some other Asian origin groups to say they have hidden part of their heritage. One-in-four Korean adults (25%) say they have done this, compared with smaller shares of Chinese (19%), Vietnamese (18%), Filipino (16%) and Japanese (14%) adults.

Asian Americans who said they have hidden part of their heritage also shared why they did so. Some of the most common reasons were a feeling of embarrassment or a lack of understanding from others.

However, different immigrant generations also cited various other reasons for hiding their culture:
  • Many recent Asian immigrants said they have tried to fit into the US and fear that others may judge them negatively for sharing their heritage.
  • US-born Asian Americans with immigrant parents often said they hid their heritage when they were growing up to fit into a predominantly White society. Some in this generation mentioned wanting to avoid reinforcing stereotypes about Asians.
  • Some multiracial Asian Americans and those with more distant immigrant roots (third generation or higher) said they had at times hidden their heritage to pass as White.
Birthplace and immigrant roots play a role in who is most likely to hide their heritage: 32% of US-born Asian adults have done this, compared with 15% of immigrants. 

Interestingly, second-generation Asian adults born in the US and whose parents were immigrants were more likely to hide their cultural heritage than their own children by almost a 3-to-1 margin (38% vs. 11%). It is as if after the desire for identifying with one's roots became stronger after a generation of denial. 

Complex struggle for identity

The generational see-saw battle between ethnic assertion and assimilation is not new. In the turbulent civil rights battles of the 60s and 70s, young Asoam adults and students found affinity with the manongs and manangs of Manilatown and Delano, in direct opposition to their parents' strategy to become more "American." 

It will be interesting to see the results of this back-and-forth pattern for identity continues. Will the fourth generation reject the third generation's search for ethnic identity or choose to become part of the American melting pot, the goal of their  grandparents?

The surge of anti-Asian hate appears to have galvanized the Asian American communities and united the generations in asserting their racial and geographical  roots. 

The same Pew study also found that Asian Americans identify more closely with their own subgroups, ie. Filipino, Chinese, Vietnamese, Indian, Japanese, Korean, Malaysian, etc. before their identify "Asian American."

Complicating matters is that the struggle for identity is constantly being stirred because of the ongoing influx of immigrants from Asia, who have to ask themselves the same questions that faced previous generations, starting the cycle anew.

For Asian Americans, the search for self-identity is an ongoing quest with many variables. There is no one answer and there is no start and finish.

A young Korean American second-generation man told the Pew researchers: 

“(T)here are going to be ups and downs. Definitely one of the downs is being labeled by other people for our differences. But one of our ups is that we have culture and language that we can always rely on; we have some diversity in customs and cultures that we could go back to. And if people are willing to experience these new differences, we can definitely pass it on and spread awareness of different cultures.” 

EDITOR'S NOTE: For additional commentary, news and views from an AANHPI perspective, follow me at Threads.net/eduardodiok@DioknoEd on Twitter or at the  blog Views From the Edge.


Wednesday, December 21, 2022

Pew Report: Asian American immigrants tell their stories of overcoming language barriers


Imagine being in a classroom, a hospital ER or a government office. People are talking and you can't understand a word. You feel frustrated, confused and ashamed That's the way life is for many new immigrants.
“There are a lot of obstacles … we can’t communicate … it is difficult … particularly [when] going to see a doctor. Sometimes we want to talk about our conditions or our health conditions, but we don’t know the words in English, especially my parents … sometimes, I have to go with them and don’t know how to explain things to the doctor.”
–Immigrant woman of Cambodian origin in mid-20s

A new study by the Pew Research Center emphasied the language and cultural obstacles that impact Asian immigrants to the US who arrive with little to no proficiency in English. But navigating life in America also impacts English-speaking immigrants as they adjust to life in a new country with its own unique linguistic and cultural quirks. Monday, (Dec. 19), the PRC released a new analysis highlighting Asian immigrants’ experiences navigating language barriers in the U.S., based on focus group interviews conducted in 2021.

The study found a little over half of Asian Americans (54%) were born outside the United States, including about seven-in-ten Asian American adults (68%). While many arrived in the U.S. within the last five years, a majority (71%) arrived in the U.S. over 10 years ago. Overall, 53% of Asian immigrants ages 5 and older who have been in the U.S. for five years or less say they speak English proficiently, a share that rises to 60% among those who have been in the country more than a decade.


New immigrant arrivals to the United States face many challenges and obstacles when navigating their daily lives. For Asian immigrants, these include language and cultural obstacles that impact those who arrive with little to no proficiency in English. But navigating life in America also impacts English-speaking immigrants as they adjust to life in a new country with its own unique linguistic and cultural quirks.

A majority of Asian Americans (54%) were born outside the United States, including about seven-in-ten Asian American adults (68%). While many Asian immigrants arrived in the United States in recent years, a majority arrived in the U.S. over 10 years ago. 

The story of Asian immigration to the US. is over a century old, and today’s Asian immigrants arrived in the country at different times and through different pathways. They also trace their roots, culture and language to more than 20 countries in Asia, including the Indian subcontinent.

Focus group participants talked about daily challenges communicating in English while getting medical care, accessing government services, learning in school and finding employment. They also mentioned the obstacles they faced understanding US culture in daily life situations, sharing their frustration, stress and at times sadness because of the barriers they encountered. 

Some participants talked about their challenges while learning English, as well as the times they received words of support and encouragement from others to overcome these language barriers.
“When I just came here and had to go to government offices for various procedures, it was easier to understand if there was a Japanese person who could explain in Japanese, but if they explained in English, I didn’t understand English and had absolutely no idea what I was supposed to do.”

–Immigrant woman of Japanese origin in mid-40s
There were participants who recalled feelings of fear at school, not only because they did not know the language but because they did not understand how American society and schools functioned. One immigrant woman of Vietnamese origin recalled not knowing whom to ask for help because no one in her family understood American culture.
“When I came to the U.S. … I went to high school immediately … my parents went to work to earn money, so I had to go to school. … But at that time, I felt very scared. I didn’t understand what people talked [about] in school at all. It was not only English, but also culture and other things, everything was different in school. Coming home, I didn’t know who to ask; no one in my family knew. Because my family came here under the sponsorship. … There were many things I didn’t understand about the culture here. I didn’t know; I didn’t dare to ask.”

–Immigrant woman of Vietnamese origin in early 40
A portion of focus groups participants came to the United States in their teenage years. These participants recalled challenging situations at school regarding their English skills. Some participants knew no English and reported having to take hours of English as a second language (ESL) classes, which left them behind in other classes in high school.
“I was already old when I first came because I was 14. I attended ninth grade but failed. I moved down to seventh grade because I could not do it. In seventh and eighth grade, it was challenging because I could not keep up with others in any of the classes in high school. I moved to ESL to learn the English language. I attended two, three hours and then I joined others again. It was a waste.”

–Immigrant woman of Laotian origin in early 50s

Among Asian Americans ages 5 and older, 58% of immigrants speak English proficiently, compared with nearly all of the U.S. born who say the same (94%).

There is language diversity among Asian immigrants living in the US. The vast majority (86%) of Asian immigrants 5 and older say they speak a language other than English at home, while 14% say they speak only English in their homes. 

The most spoken non-English language among Asian immigrants is Chinese, including Mandarin and Cantonese (20%). Hindi (18%) is the second most commonly spoken non-English language among Asian immigrants (this figure includes Urdu, Bengali and other Indo-Iranian and Indo-European languages), followed by Tagalog and other Filipino languages (13%) and Vietnamese (9%). 

This reflects the languages of the four largest Asian origin groups (Chinese, Indian, Filipino and Vietnamese) living in the US But overall, many other languages are spoken at home by Asian immigrants. (See above chart.)

The Pew study was conducted in 2021 with 49 focus groups with Asian immigrants to understand the challenges they faced, if any, after arriving in the country. The focus groups consisted of 18 distinct Asian origins and were conducted in 17 Asian languages.

EDITOR'S NOTE: For additional commentary, news and views from an AANHPI perspective, follow @DioknoEd on Twitter.

Thursday, October 13, 2022

Pew Research Center: Asian American voters are an increasingly influential electorate


After making an impact in the 2020 elections, and fighting against attempts to temper their vote, the AANHPI community is hard to ignore heading into the Nov. 8 Midterm elections.

This November, about 13.3 million Asian Americans will be eligible to vote, making up 5.5% of all eligible voters, according to Pew Research Center projections.

Asian Americans  are still the fastest-growing community and leans towards the Democrats, according to information released by the Pew Research Center Wednesday. Asian American eligible voters are still growing three times faster than other demographic groups.

Fifty-seven percent of English-speaking, Asian registered voters said they would likely vote for the Democratic candidate in their US House of Representatives district race, while 26% said they would likely support the Republican candidate. In midterm elections, voter turnout rates are typically low so if AANHPI community advocates can muster their communities to go to the polls their impact could be greater than their actual numbers.

The Pew Research Center presents some quick facts about this year's Asian American electorate:

1. As of 2020, the majority of Asian American eligible voters (56%) live in only five states. California has the highest number of Asian American eligible voters by far (4.2 million). The state is home to nearly a third (32%) of the entire U.S. Asian electorate. 

The state with the second-most Asian American eligible voters is New York (1.1 million), followed by Texas (930,000), Hawaii (565,000) and New Jersey (505,000).


2. Hawaii is the only state where Asian Americans make up a majority of the eligible voter population. Asian Americans make up 55% of the electorate in Hawaii, the only state where a racial or ethnic group other than single-race White, non-Hispanic eligible voters are the majority. Following Hawaii, the states with the largest shares of Asian eligible voters are California (16%) and Nevada (10%).

Hawaii also has the highest share of eligible voters within its Asian population. Seven-in-ten Asians in Hawaii are eligible to vote, the highest share of any state with an Asian population of 50,000 or more. Following Hawaii on this measure are Nevada (64%), California (61%), Louisiana (60%) and Florida (59%).

3. 
Overall, more than half of all Asian Americans in the U.S. (56%) are eligible to vote, compared with 72% of the total U.S. population. Asian Americans are less likely than Americans overall to be eligible to vote because a significant share are immigrants who are not U.S. citizens. 

4.
A majority of Asian American eligible voters (57%) are naturalized citizens, rather than U.S.-born citizens. Asian Americans are the only major racial or ethnic group where the majority of eligible voters are naturalized citizens. A smaller share of Asian American eligible voters (43%) are U.S.-born citizen.

5. Asian American voters are more likely than the overall eligible voter population to have a bachelor’s degree. As of 2020, half of Asian American eligible voters have a bachelor’s degree or more education. By comparison, about a third (33%) of the total eligible voter population has at least a bachelor’s degree. Asian eligible voters are also more likely than the general eligible voter population to have a postgraduate degree of some kind, such as a master’s degree or law degree (19% vs. 12%). Pew analyses from earlier releases found that educational attainment varies widely among different Asian American subgroups.

6. Asian Americans are slightly younger than other voters. The median age for Asian American eligible voters is 44, compared with 48 among the broader population of eligible voters. And 36% of Asian American eligible voters are ages 30 to 49, compared with 32% of the total eligible voter population.


EDITOR'S NOTE: For additional commentary, news and views from an AANHPI perspective, follow @DioknoEd on Twitter.


Tuesday, March 16, 2021

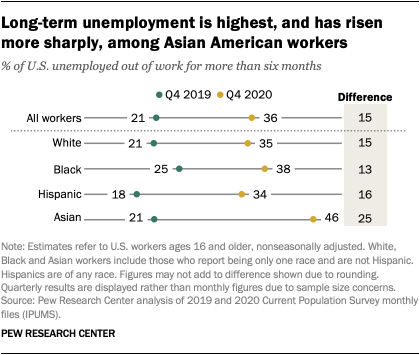
Coronavirus impact: Asian Americans are staying jobless for longer periods of time


The economic downturn caused by the coronavirus pandemic continues to take a toll among American workers.  Asian Americans are getting hit hard as more of them stay jobless for longer periods of time.

Data released Thursday by the Pew Research Center shows another crack in the model minority myth that distorts the image most Americans have of Asian Americans.

As the U.S. economy copes with the effects of the coronavirus outbreak, a rapidly rising share of unemployed Americans find themselves out of a job despite many months of searching. 

Even amid signs of improvement in the U.S. labor market overall, about four-in-ten unemployed workers had been out of work for more than six months in February 2021, about double the share in February 2020. At the same time, a growing number of job seekers are becoming discouraged, leaving the labor force entirely, according to a new Pew Research Center analysis of government data.

The number of Americans who are out of work and have experienced long-term unemployment – that is, those who have been looking for a job for more than six months – has increased considerably in the year since the start of the COVID-19 recession. 

By February 2021, 4.1 million Americans were among the long-term unemployed, without work since at least August, making up 2.6% of the workforce overall. The sharp rise in long-term unemployment in the current recession stands in stark contrast to the Great Recession of 2007-09, when it took nearly two years for the long-term unemployment rate to reach similar heights. Job losses during the coronavirus recession have affected some demographic groups more than others, and the rise in long-term unemployment has been greater among Asian American unemployed workers, especially men.

Likewise, the ranks of discouraged workers – unemployed workers who are currently not looking for work because they believe no jobs are available for them or there are none for which they qualify – have swelled in recent months. About 529,000 Americans were classified as discouraged workers in February 2021, roughly 100,000 more than the number one year ago.

Long-term unemployment rose more sharply among Asian American workers who are unemployed. In the fourth quarter of 2020, nearly half of unemployed Asian workers (46%) had been out of work for more than six months, compared with 21% in the fourth quarter of 2019. Black unemployed workers had the next highest long-term unemployment rate (38%) at the end of 2020, followed by White (35%) and Hispanic (34%) unemployed workers. For these three groups of unemployed workers, the long-term unemployment rate was around 15 percentage points higher than one year earlier.


These patterns differ from the percent of all workers who are unemployed regardless of duration. Black workers (9.8%) had the highest unemployment rate overall in the fourth quarter of 2020, followed by Hispanic (8.7%), Asian (6.3%) and White workers (5.1%).

The reason for the relatively high long-term unemployment rate among Asian unemployed workers is not entirely clear. But it may be partially explained by the fact that they tend to be disproportionately represented in states most impacted by coronavirus shutdowns. 

Nearly a third of Asian Americans (31%) lived in California in 2019, a state that had some of the longest shutdowns and most severe outbreaks in 2020. 

New York is the state with the second largest share of the Asian population (9%) and suffered the third most employment losses since the start of the pandemic.